Summary
In industrial environments, there is usually a need to separate employees from machinery in order to ensure worker safety. For example, to prevent personnel from approaching when dangerous equipment, such as saws or industrial robots, is in operation.
A common way to ensure this separation is by creating a virtual fencs using equipment known as a “light curtain” or “laser light barrier”, mounted at an access point, such as a door.
They consist of two parts, a light beam emitter (typically infrared) and a receiver mounted directly in front of the emitter. If the light beam is interrupted by a person or object passing between the parts, an automatic action, such as turning off the equipment or sounding an alarm, can be performed.
Although these devices work well, they have a crucial limitation: the cost scales with the number of points to be monitored. In addition, flexibility leaves something to be desired: to change the monitored area, it is necessary to uninstall the curtain from the original location and install it in the new location, incurring maintenance costs, not to mention production downtime.
What if there was a way to monitor multiple risk areas with a single device that could be reconfigured quickly, without maintenance costs and downtime? The good news is that this technology not only exists, but is affordable and easy to implement.
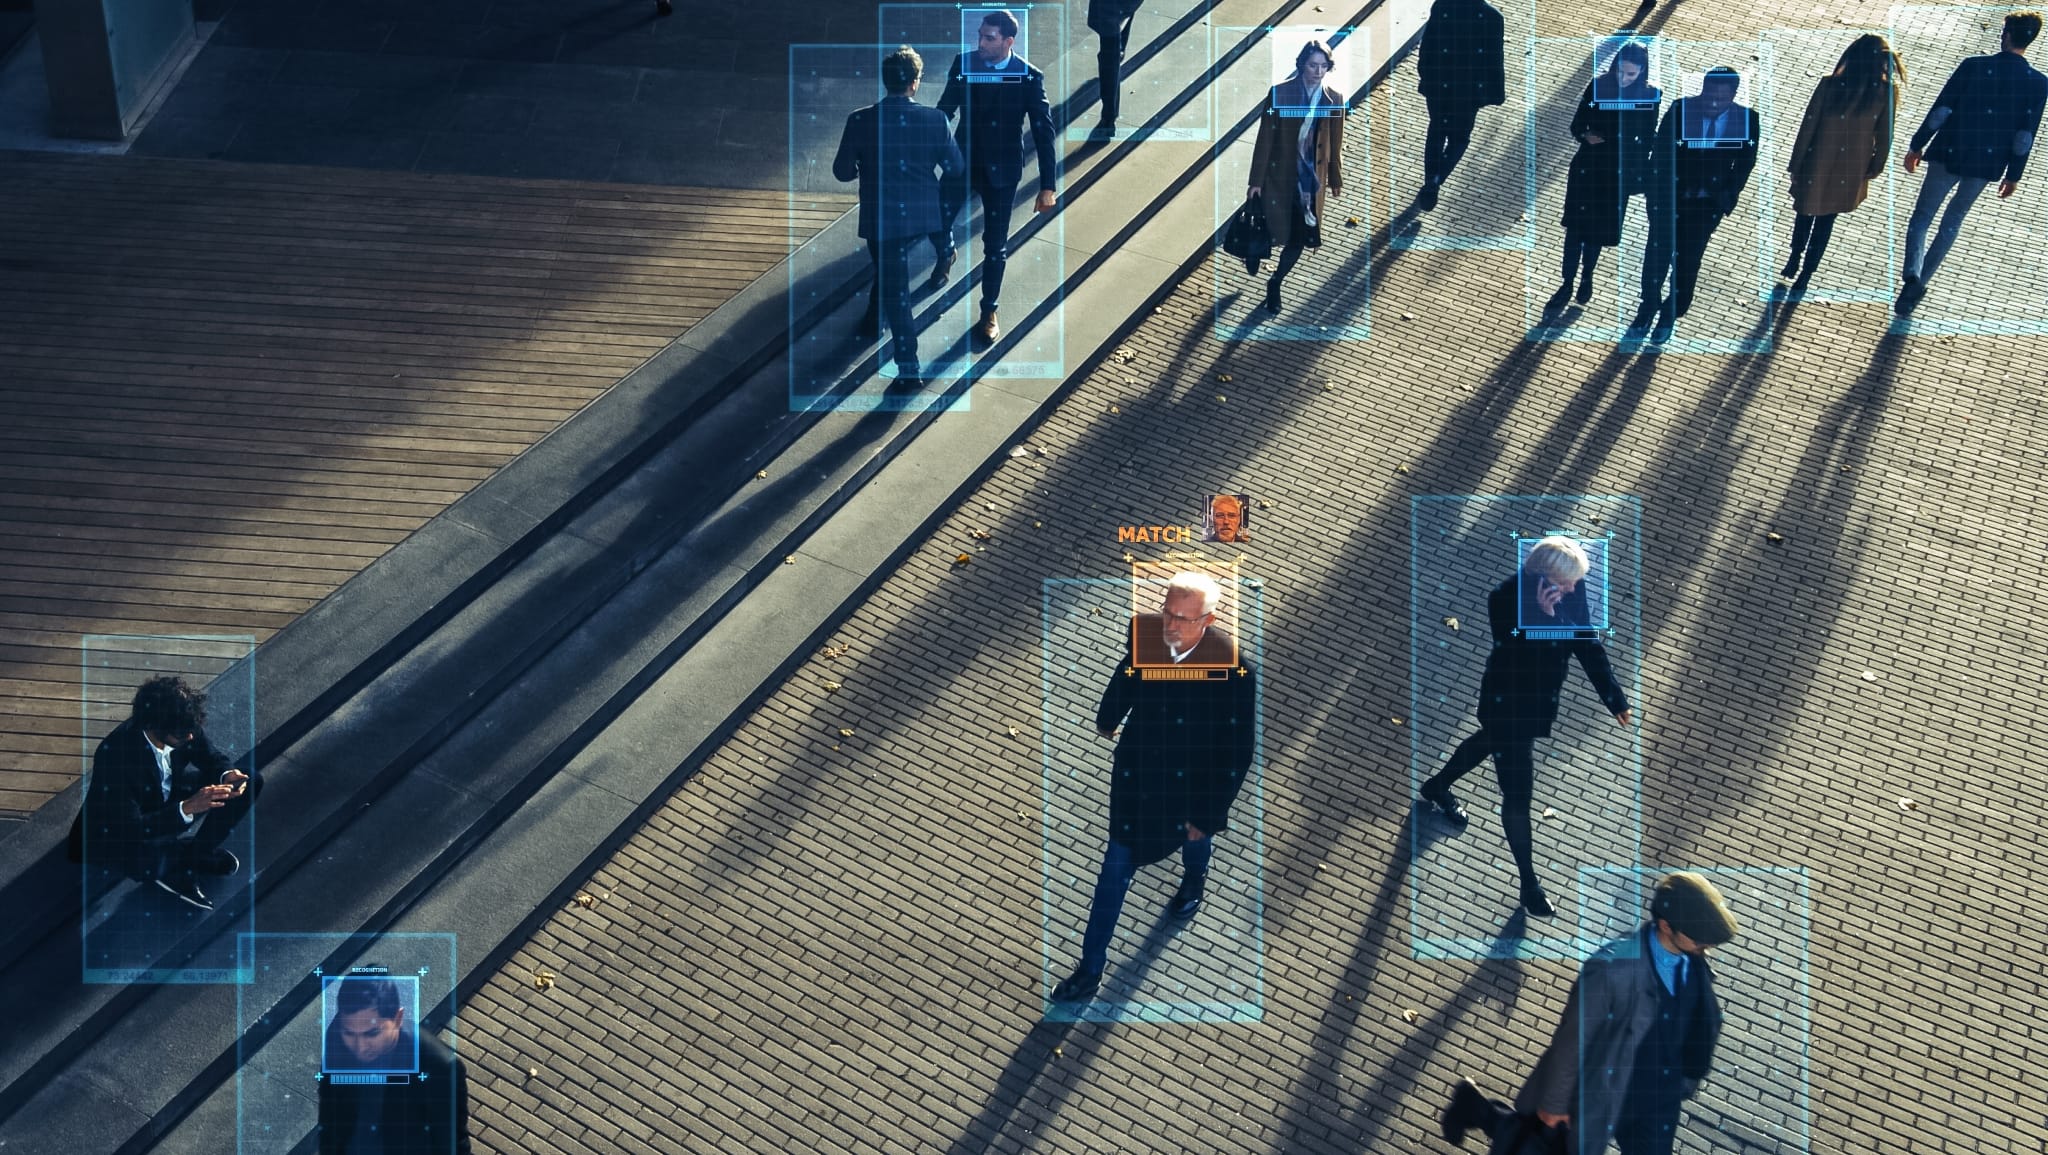
With AIOS, dtLabs’ Edge AI and computer vision platform, you can use your existing cameras to create virtual fences and monitor risk areas on the factory floor, ensuring the safety of your workers. A single camera can monitor multiple points simultaneously, and configuring the monitored areas is as easy as drawing a shape with your mouse. Want to see how? Read this article.
To follow this tutorial, you will need access to AIOS and an AIBox, as well as an IP video source (an RTSP stream) that can be connected to the platform. However, even without access to the system, you will quickly understand the ease of use and flexibility of our software.
Pipelines and Components
AIOS works with the concept of Components and Pipelines. A component is an object that performs a simple task, such as receiving video from a camera, detecting an object, counting the number of times an event occurs, or identifying changes in an area of the image. A pipeline is the name given to a set of interconnected components that capture and process the image for a specific purpose.
All work in AIOS occurs in a pipeline. So the first thing we have to do is create one. In the AIOS interface, select the item Pipelines (the triangle) in the toolbar on the left of the screen, and then click the button +Add Pipeline, in the upper right corner.
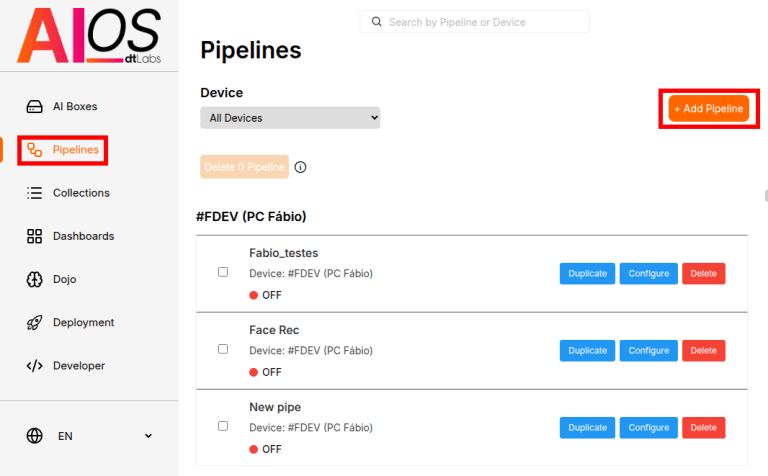
In the next window, enter a name for your pipeline, select the device (AI Box) where it will be created, and click Create pipeline. You’ll then be taken to the preview screen, which shows an overview of your pipeline on the left and a detection preview on the right. Since your pipeline is currently empty, these areas will be empty as well. Click Edit to open the pipeline editor.
Let’s take a moment to get familiar with the editor interface. The large empty area below your pipeline’s name is the workspace, where you’ll place the components that make up your pipeline. On the right side, you’ll find a list of available components, and above it, a search bar that lets you find components by name.

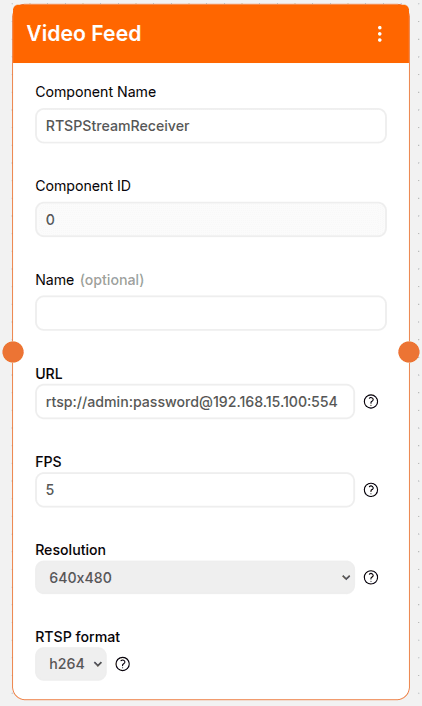
The first component we will use is the Video Feed, which indicates the video source we will use for detection, as well as the associated parameters. Just drag it from the list on the right of the screen to an empty space on the workspace.
The component has some parameters that we must configure. URL is the URL of the camera video stream that will be used for detection, in the format rtsp://admin:password@192.168.15.100:554.
The parameters admin and password are, respectively, the username and password required to access the stream. After the @ we have the camera’s IP address (in the example, 192.168.15.100) and port (554). It is worth remembering that the parameters shown here are just examples, you must fill in the actual values corresponding to your camera.
In FPS you must enter the number of frames per second that will be processed during detection, between 1 and 10. For this use case, 5 FPS is enough. In RTSP-format, enter the format (codec) used by your camera in the video stream. For example, h264. We won’t need to change any other values now.
Now let’s add one more component to our workspace, called Person Detection. Position it to the right of the Video Feed component. For them to be able to communicate, they need to be connected: to do this, simply click on the orange circle at the right edge of the Video Feed component and drag your mouse to the orange circle at the left edge of the Person Detection component. A dotted line will appear, indicating the connection between them.

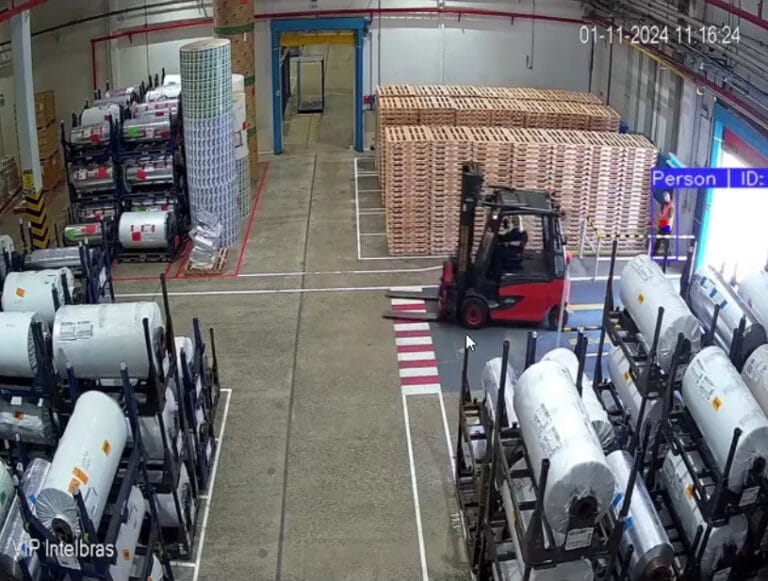
Now we can test whether our pipeline is detecting people. Click the Save button and on the next screen, click the Play button (the triangle) at the top of the page. After a few seconds, you should see the video from the camera, and if any person appears in the image, they will be clearly marked.
Marking a virtual fence
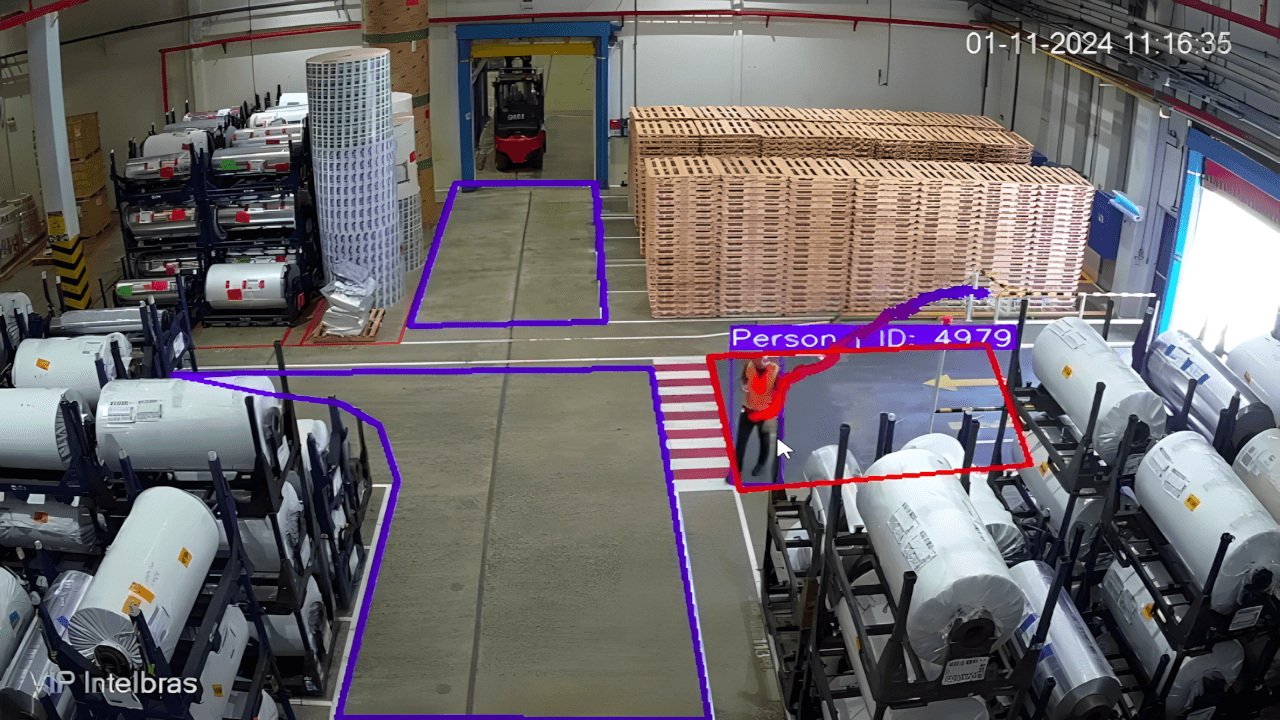
Pause the preview by clicking the Stop button at the top of the page, and click Edit. Let’s add one more component to the pipeline, called Detection in Polygon. As before, connect this component to the previous one (Person Detection). In Polygon Detection, click on the drop-down menu below Classes: and check the option Select All to select all detectable object classes (there should be only one, Person).
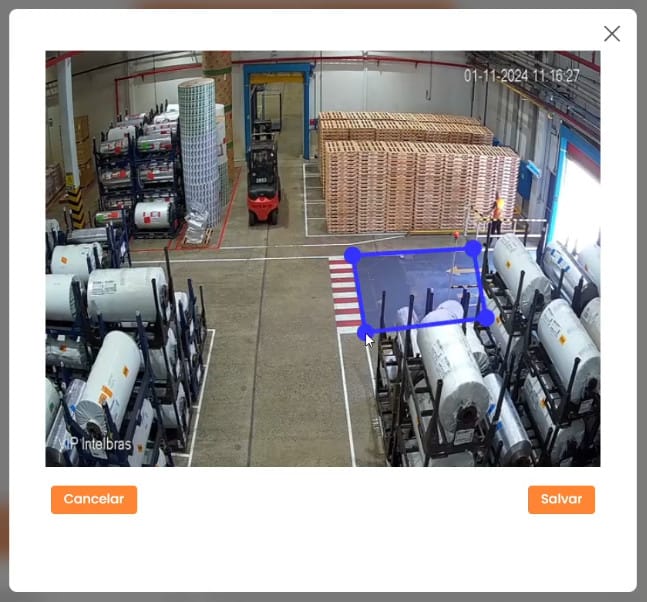
Now we will mark the first area where we do not want people wandering in. Click on the pencil in Polygon Detection, and a window will appear with an image from the camera. To draw the boundary, simply left-click on the four corners of the area you want to demarcate. If necessary, you can adjust the shape of the polygon by dragging the corners (indicated by the circles) with the mouse. With the region demarcated, click on Save.
If you want to demarcate more areas, just add another Polygon Detection component and repeat the process. Don’t forget that each component must be connected to the Person Detection component.
WhatsApp Alerts
Now let’s define what happens when a person is detected. In this example, we will send an alert message via WhatsApp, but it is also possible to trigger a PLC to sound a siren or turn off a device (see our tutorial on forklift detection for an example on how to do this).
Drag the WhatsApp component to the workspace and connect it to the Polygon Detection component. In Phone number, indicate the phone number that will receive the alert. This number must be indicated in the format Country Code (IDD) + Area Code + Phone Number. In Custom Message, type the text that will be sent with the alert. For example: “Person detected in Area 1”.
Set “Send Image” to True if you want an image of the detection to be sent with the alert. Finally, in Time between notifications, set a sending interval, in seconds, for notifications. For example, if set to 5 seconds, the recipient will receive a notification every 5 seconds while a person is in the fenced area.
To test the detection, simply save the pipeline and click the Play button on the next screen. If a person is detected in an area, the phone number provided will receive a message.

Kanban Alerts
An alternative is to generate an alert via Kanban, with the KanbanNotification component. Just add it to the workspace and connect it to the Polygon Detection component. This component has six parameters that can be adjusted.

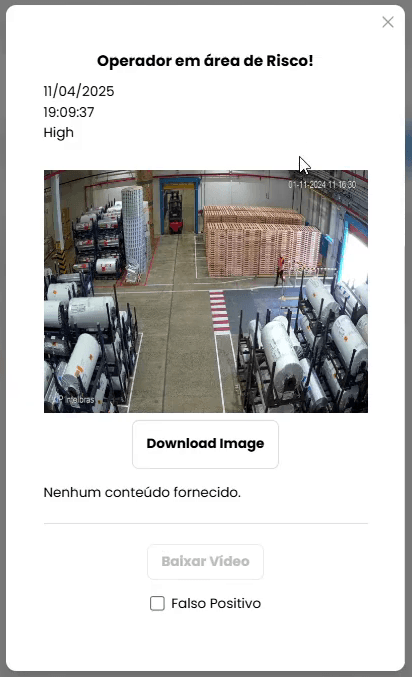
In Description, add a brief text that will be included in the notification. For example: “Person detected in Area 1”. In the Criticality Level menu, indicate the severity of the notification, among four levels Low, Medium, High or Critical. If desired, you can also choose a color for the notification in the Color menu.
In Time Between Notifications, set a time interval between each notification, in seconds. This option works the same way as in the WhatsApp Message component: If set to 5 seconds, the recipient will receive a notification every 5 seconds while a person is in the fenced area.
Along with the notification, it is also possible to send an image of the detection by checking the Save Image(s) option, or a video by checking the Save Video(s) option. In this case, the drop-down menu below the option allows you to select the duration of the uploaded video, between 5 or 10 seconds.
Creating a Dashboard
Now, we need to create a Dashboard where Kanban alerts will be displayed. Select the Dashboards icon from the menu on the left of the screen, and on the next screen, click the button +Add Dashboard in the upper right corner. Enter a name for the Dashboard (e.g. “Risk Area”) and, if you wish, choose an image (logo) to personalize it.
Your new Dashboard is empty, and we need to add a Widget to display the alerts. Click on the +Widget button in the upper right corner of the screen. On the screen that appears, click on the menu below Widget Type and choose Kanban. Add a descriptive name in Board Name and in Pipeline choose the pipeline where we set up the detection.
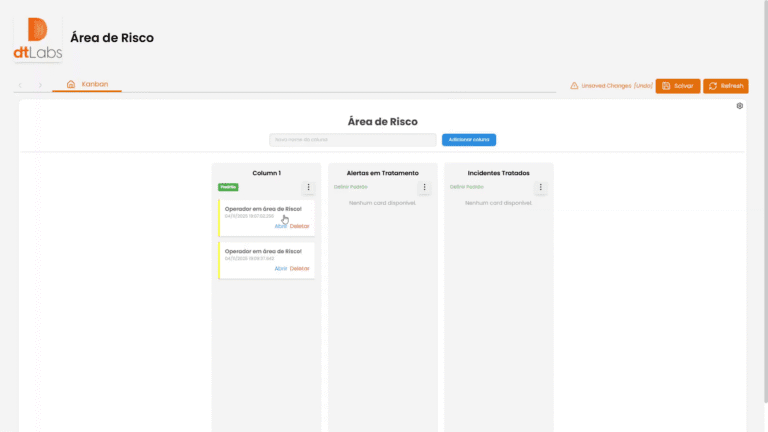
A column will appear on your Dashboard, where cards will be created each time a person is detected in a risk area. If you wish, you can create other columns to make it easier to manage the cards, such as one for alerts being treated and another for those already treated. To do this, simply type a name in the field at the top of the screen and click Add column.
With the dashboard configured to your liking, save it by clicking the Save button in the top right corner of the page. Dashboards can be shared with third parties, making it easier to share information. To do this, simply click the share icon, just above the save button, to generate a URL. When sharing a dashboard, you can decide whether it is public or private. In the latter case, you can set a password, which will be required to access it.
Analyzing Data
AIOS is not limited to detecting and issuing alerts. You can also add other data analysis widgets to your dashboard, which will give you a deeper insight into the situation.
One example is the incident counter. With it, you can determine whether an alert is a one-off, or whether your employees are consistently violating safety standards, and where this occurs.
To do this, we will add a new tab to the Dashboard by clicking on the + icon next to the Dashboard name in the top left corner of the screen. Enter a name for the new tab (e.g. Incidents by Area) and choose an icon to identify it. Click the Add Tab button.
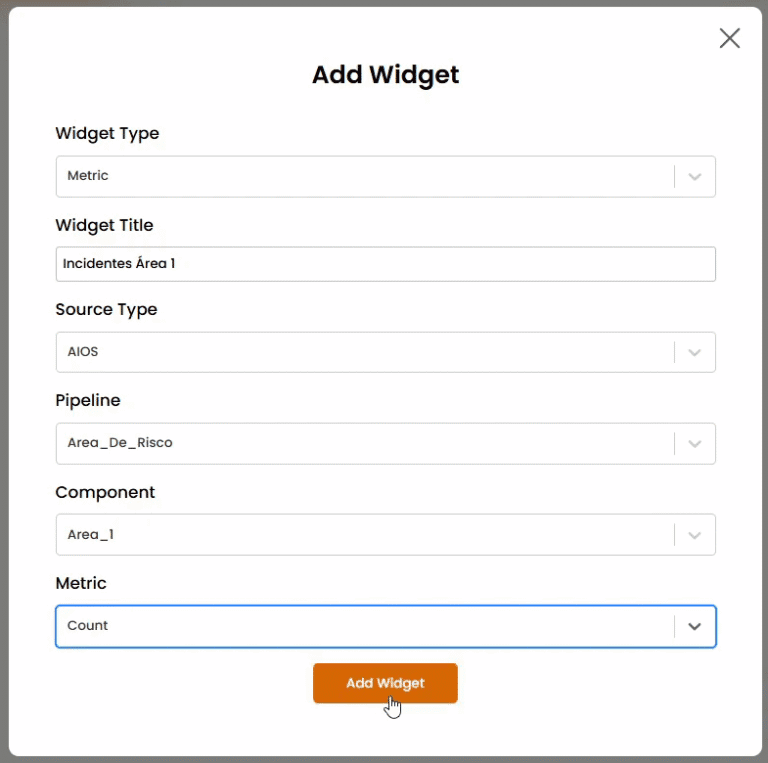
Now let’s add a widget to the new tab. Click on the +Widget button in the upper right corner of the screen. In Widget Type, choose Metric. In Widget Title, enter a descriptive title, such as “Incidents in Area 1”. In Source Type choice AIOS, and in Pipeline select the one where we set up the monitoring.
In Component, select the component that will be the source of the notifications. In our example, it is the Polygon Detection component that we configured back then. Finally, in Metric, select Count. Click the Add Widget button.
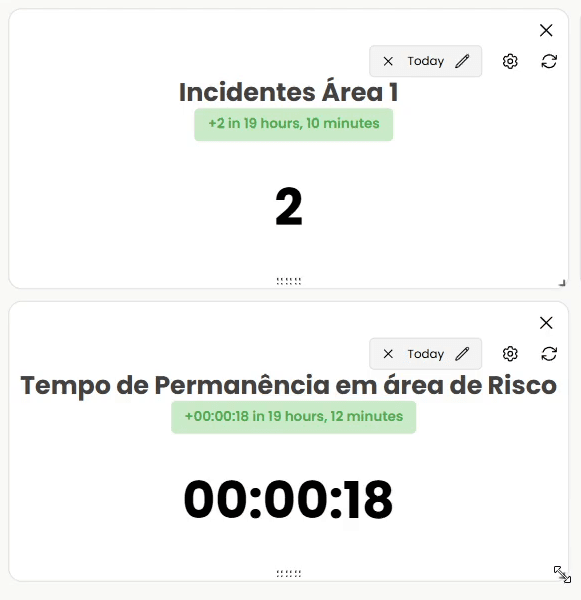
You will immediately see a widget with the incident count in that area. By clicking on the calendar icon in the upper right corner of the widget, you can define a period for the analysis, such as today or the last month, among others.
There are other kinds of metrics that can be added. In addition to knowing how many times your employees entered restricted areas, you can find out how much time they spent there. To do this, repeat the process to create a Widget, but in Metric choose Cumulative Time in Polygon.
That’s it! Our virtual fencing solution is done, complete with data analysis.
Conclusion
As we have shown, with AIOS it is easy to create a sophisticated monitoring solution that can not only alert to incidents, but also provide useful data to understand the frequency and severity of the problem, assisting in its resolution.
And monitoring risk areas with virtual fences is not the only solution that AIOS is capable of. It can detect the use of PPE (Personal Protective Equipment) by your employees, monitor forklift traffic, automate license plate reading, automate volumetric calculations, perform quality control on a production line, identify fire and smoke, monitor parking spaces, and much more. It is impossible to list all the possibilities in a single article.
AIOS’s flexibility sets it apart as a comprehensive and versatile platform in the field of computer vision and edge AI. With its capabilities to serve a variety of industries—from manufacturing to logistics, from security to smart cities—AIOS delivers innovative solutions that transform visual data into actionable insights and tangible results, without the need for technical expertise.
Count on AIOS to accelerate your digital transformation journey, and discover why we have satisfied customers in over 15 countries.