Summary
In today’s physical retail, store space has evolved from a mere transaction point into an ecosystem where every square foot is a valuable, costly asset that must generate returns. Boosting performance in every linear foot of the store isn’t just about visual merchandising—it’s a core strategic lever with a direct, measurable impact on your business’s return on investment.
The way you design the store environment and layout heavily influences buying behavior. Studies show that up to 60% of purchase decisions happen right at the shelf. Get the setup wrong, and the cost is steep: 64% of shoppers abandon their carts—and the store—without buying anything if the space feels cluttered and hard to navigate.
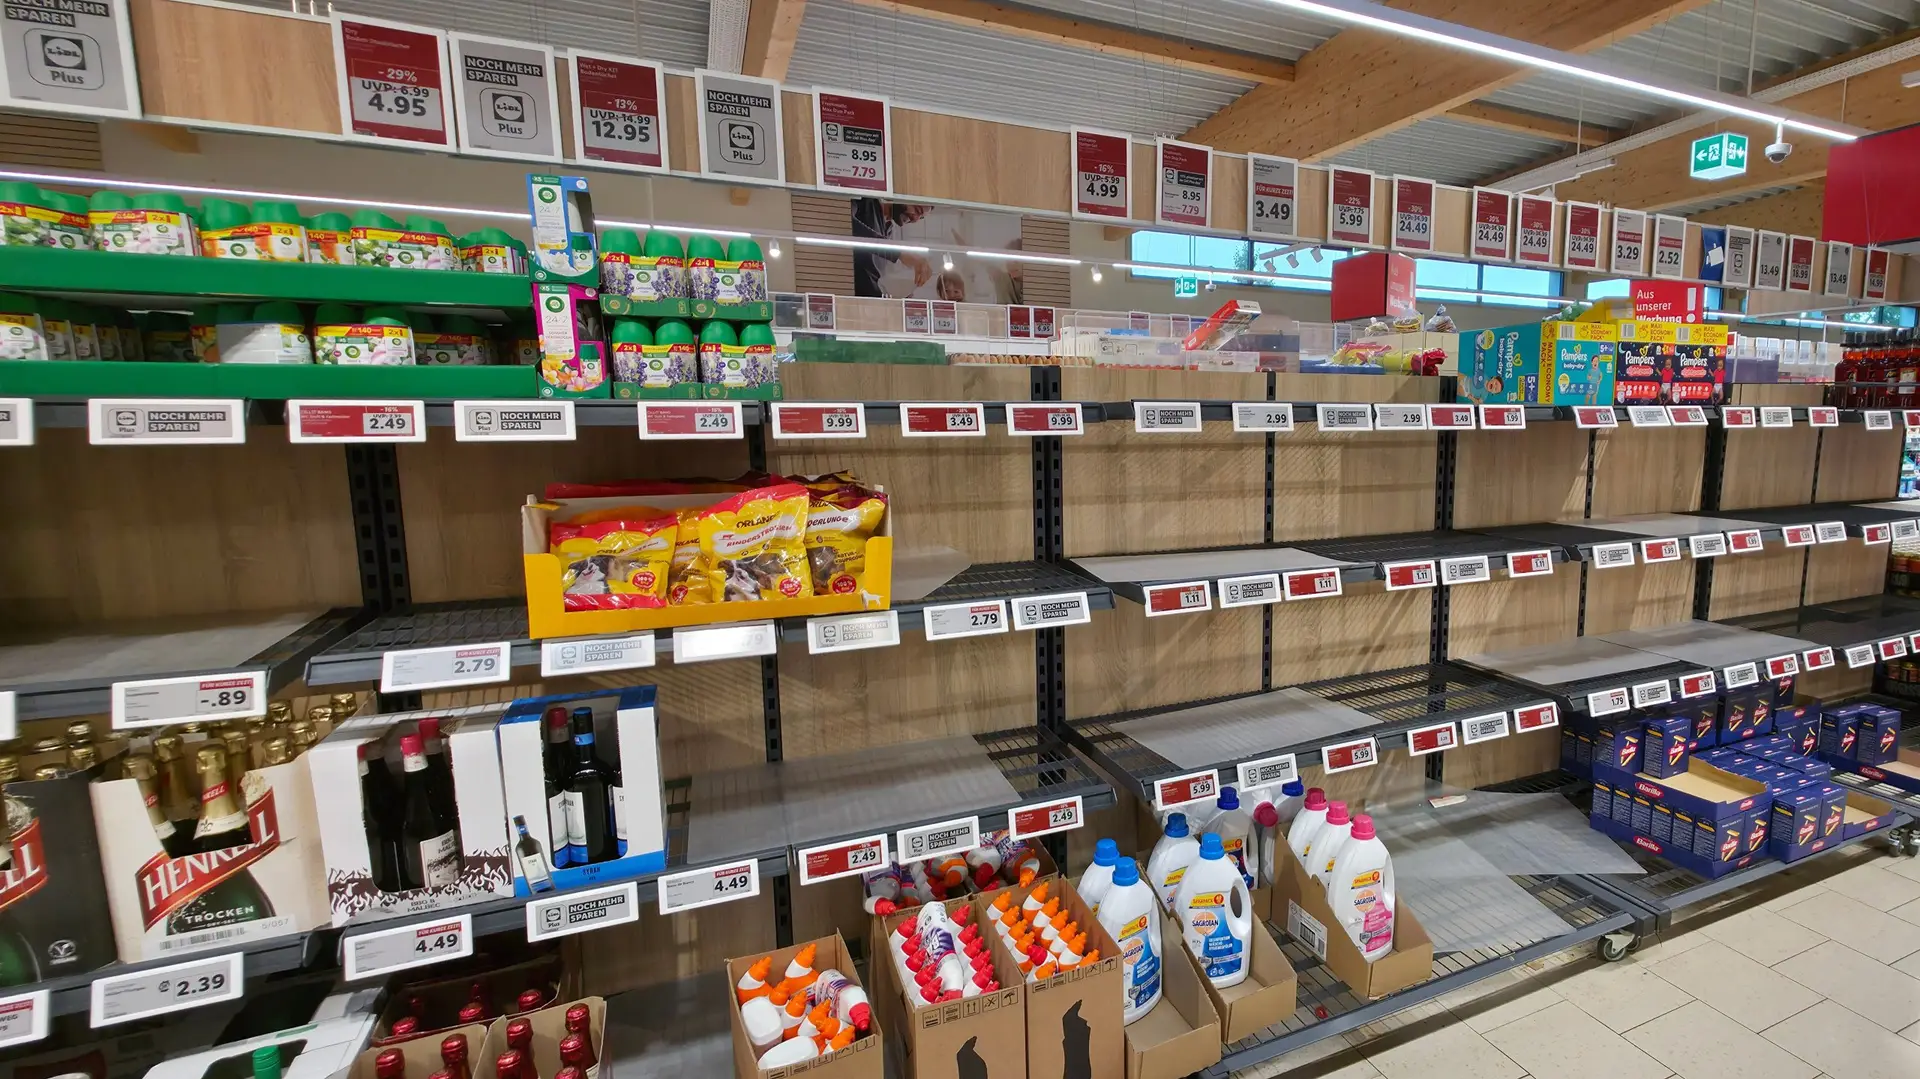
Beyond navigation frustration, stores quietly leak revenue due to poor product visibility—customers won’t buy what they can’t see. Human visual attention is highly selective and limited, making a product’s vertical position make-or-break for its success.
Products lucky enough to land in the “Golden Zone” (eye level, typically 48–67 inches off the ground) can capture 35–40% of their category’s total sales. By contrast, the same items on lower shelves—requiring customers to bend down—account for just 15–20% of sales.
When high-priority products get stuck in these invisible “dead zones,” the store suffers a silent financial drain: demand might be there, but poor exposure kills conversions.
The Problem: Blind Spots in Store Layout
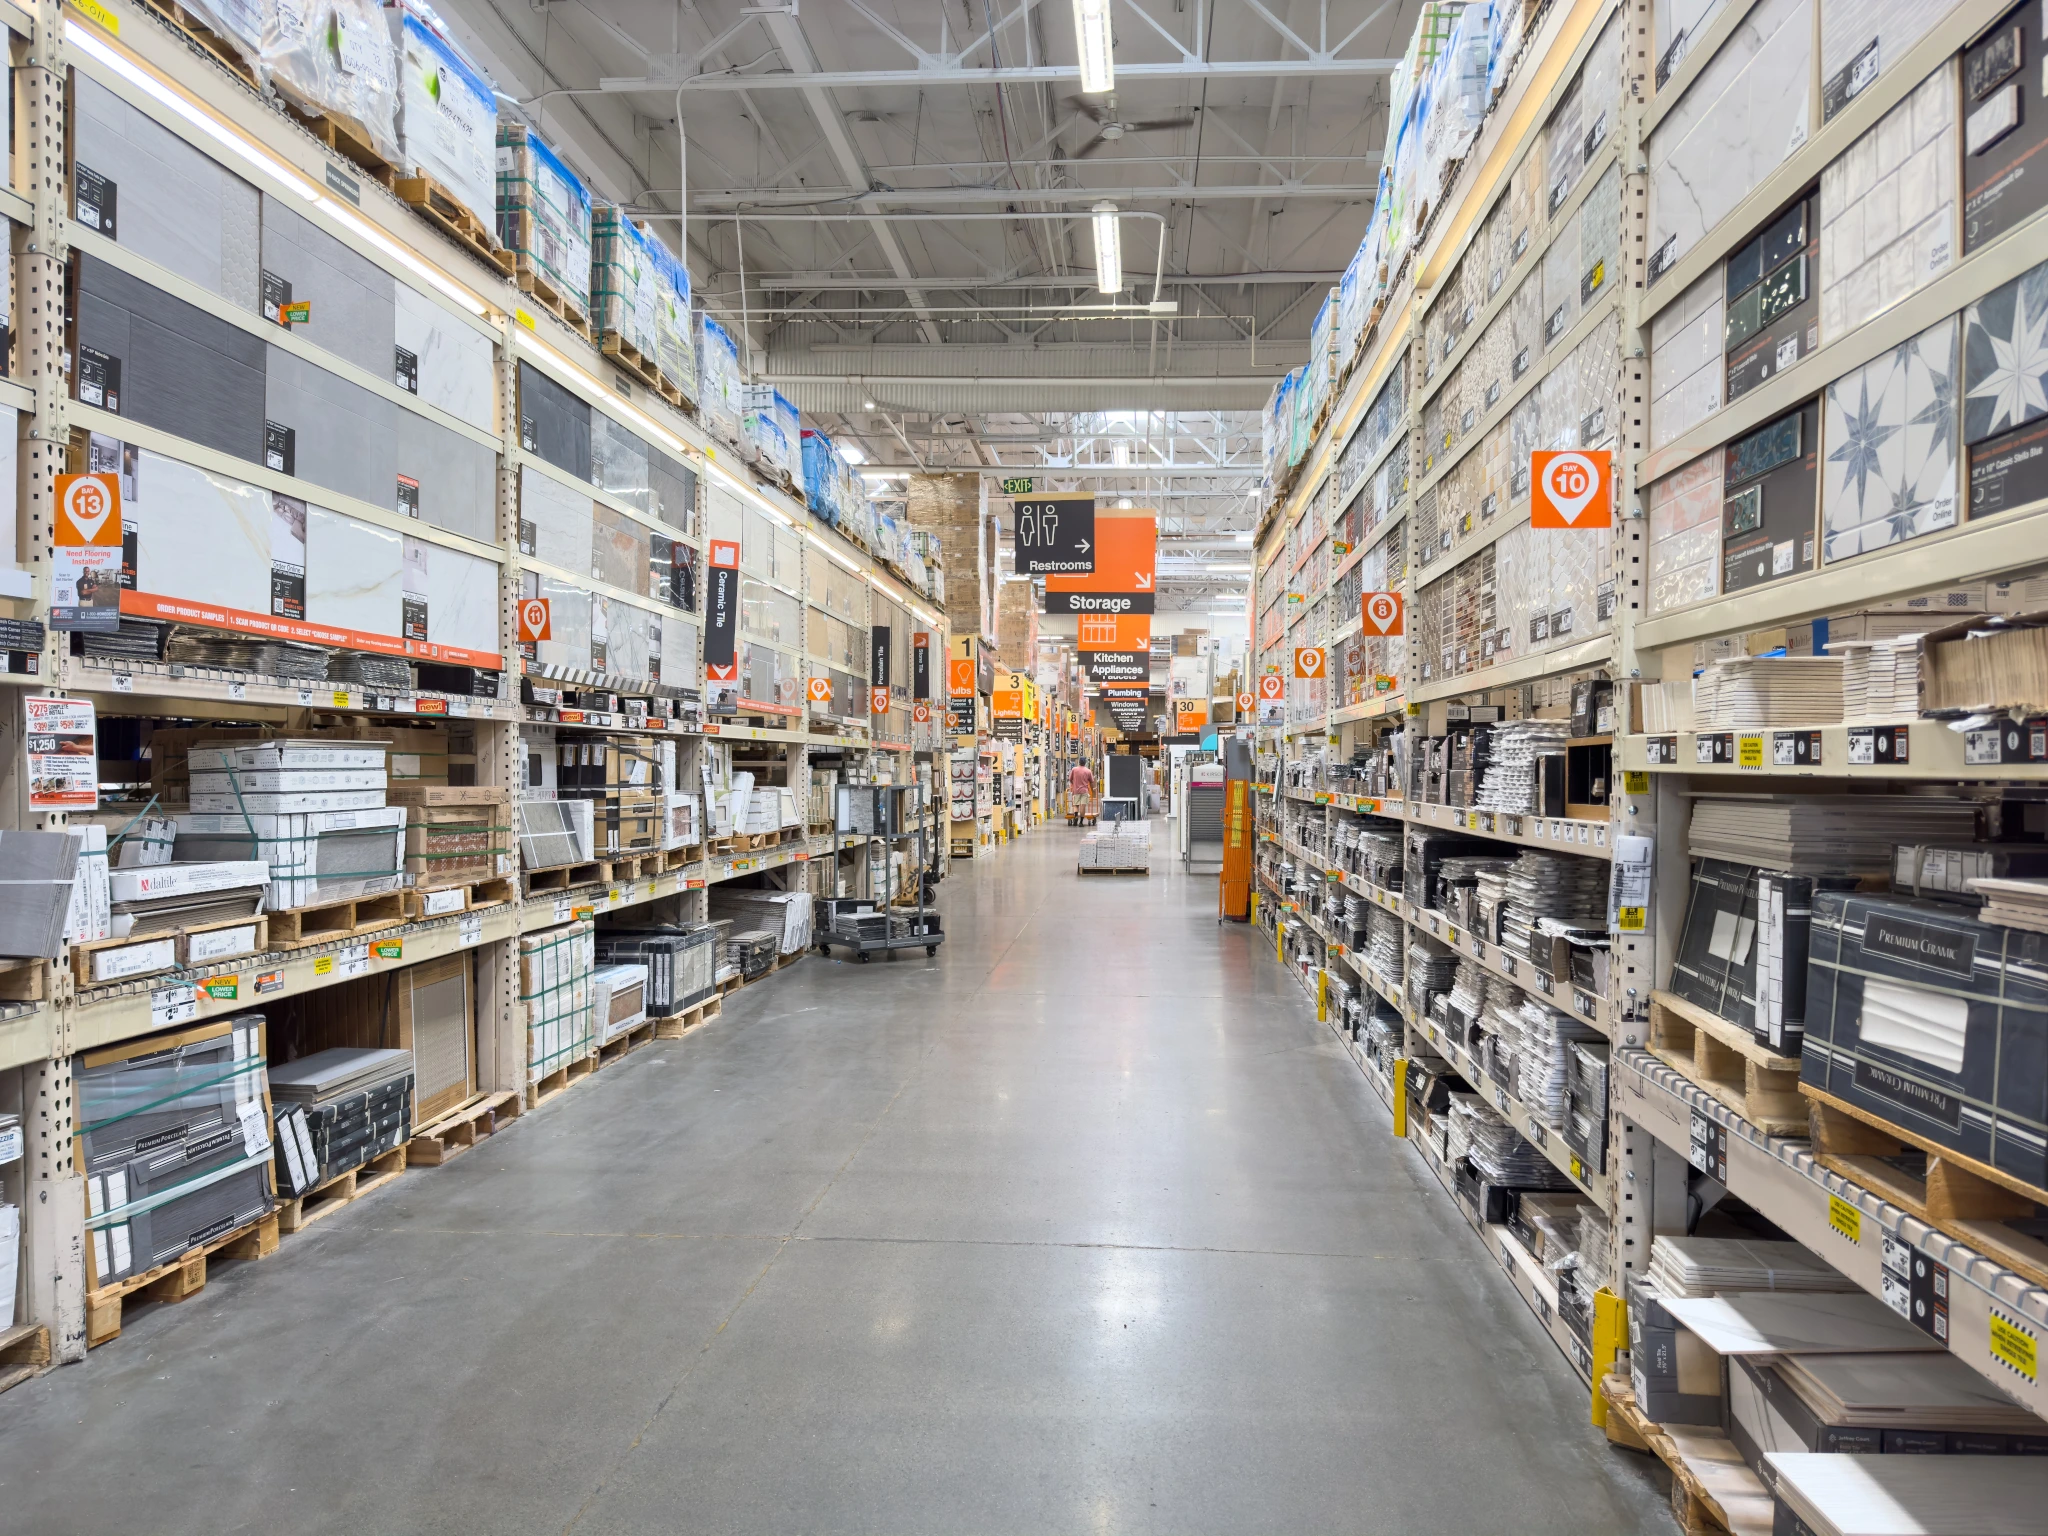
Every retail manager has encountered that one aisle or corner that repels customers like a magnet in reverse. These “dead zones” or blind spots don’t happen by accident. They’re usually born from structural and layout flaws: furniture that’s too tall and blocks sightlines, overcrowded displays that create visual clutter and overwhelm shoppers’ brains, or simply a lack of high-interest “anchor” products positioned to naturally draw foot traffic into those areas.
The real-world impact of this poor space allocation is brutal. When analytics systems roll out in pilot stores, the data paints a stark picture: certain corners or aisles get just 5–10% of total store traffic compared to nearby main aisles. In practice, that means shelling out hefty operational costs for square footage that customers actively avoid—pure wasted shelf space.
The real trap of underutilization, though, is “flying blind” in management decisions. Without precise pathing data, retailers rely on gut instinct, and risks skyrocket. It’s all too common to stick high-value items, strategic launches, or high-margin products right in these invisible spots.
If a store section goes ignored by shoppers, anything stocked there will see a sharp drop in sales potential—not due to weak demand or product flaws, but because customers never even reach it.
The Solution: Consumer Behavior Analysis
To fight physical space inefficiency, store layouts can’t be static or guesswork-based. The antidote to “flying blind” is integrating analytics solutions that turn your existing store cameras into smart sensors.
These tools process real-time footage from cameras you already have, anonymously tracking customer paths and movements to turn physical journeys into precise flow and behavior data.
The most straightforward application is generating heatmaps—visual overlays on your store floor plan that use color gradients (warm for high activity, cool for low) to show traffic intensity in every aisle.
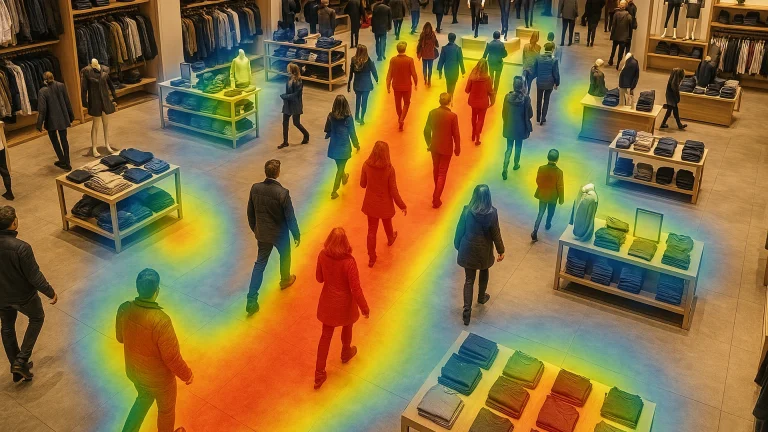
With this, managers get undeniable visuals of hotspots (high-density, high-engagement areas) and can pinpoint exact “dead zones” or stagnation spots. What used to be a hunch becomes hard visual proof.
But the real power goes deeper than just mapping paths—it measures interaction quality via Dwell Time, or how long customers linger in specific areas.
For instance, a manager might spot an aisle with heavy foot traffic but super-low dwell time. That screams low engagement: people walk by but don’t stop to browse.
Armed with heatmaps and dwell time insights, store teams can act fast—tweaking lighting, signage, or shelf height on underperforming displays to boost appeal.
Data-Driven Decisions to Optimize Results
The biggest game-changer behavioral analysis brings to physical retail is applying e-commerce’s scientific rigor to the real world. Armed with precise traffic data and heatmaps, managers ditch gut feelings for tools like physical A/B tests—one of the safest, most powerful ways to validate layout changes.
In practice, this means running structured experiments. If data flags a dead zone, the team crafts a new layout (Layout B)—maybe repositioning a display, adjusting gondola height, or widening a cramped aisle—and compares it to the current setup (Layout A). Run these side-by-side in similar stores (parallel testing) or sequentially in the same location.
Instead of just “hoping” it worked, tech delivers proof through hard metrics: Did dwell time rise? Conversion rates improve in that spot? The winning layout, backed by data, becomes the new standard.
Ultimately, the key takeaway is that store layouts can’t be static projects or quinquennial overhauls anymore—they demand iterative, continuous improvement. Modern physical retail is a living data ecosystem, where every pricey square foot must constantly earn its keep.
By decoding real customer movement, retailers wipe out blind spots and ensure their entire space drives discovery and sales.